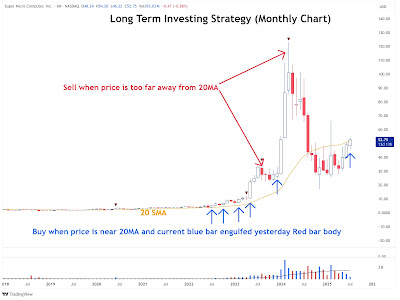
Chart taken from: 10.10.24 - sold iFast at top channel. (to enlarge chart picture, click on it)
Above is an actual small trade
setup for IFAST Stock to perform Risks to Rewards analysis before
I press the button
to buy or sell.
1) Enter the
following information into the Profit & Loss Calculator
a) No. of shares ; taken from the Position Sizer
b) Buy Price ; Entry Price
c) Cut Price ; Stop Price (below recent support level)
d) Target Price: (Near term resistance level)
2) Once this is done, you will know the following
A) Risk to Reward Ratio ; whether a trade should be taken or walked away
B) Break Even Level ; when the trade will become profitable.
C) Potential Profit & Loss Amount
With a customized risk calculator that I have
programmed many years back, assisted me to determine
if the risk is worth to take or just let it go
instead.
What make a good trader is nothing more than the
tools he uses to trade the market. With simple
tool like this calculator, once can easily walk
away from lousy deal, instead look for another stock
that presents better returns although there is no
guarantee to win in trading. But we close the gap
up to make a good trade.
As you can see in this calculator, I have the
cutloss level just beside the target level (near term resistance)
where I make this the 1st priority in any trading.
Always determine where will be the cutloss, so that
you can easily obtain the risk and reward ratio at
the end of the calculator. With this estimation of
the risk that you have to take in order to receive
the rewards, you can easily make a quick decision whether to
take the
trade or just leave it along.
Many times, when we found a stock that is trading
with excessive volume and has been trading higher for past
few days, we
may have the urge to jump into the stock without analyzing chart on the
possibly near term resistance
or support. With this risk calculator, you
can easily enter the buy price (support level) and sell price (near term
resistance level) and cutloss (below recent support level). Once you have all
these data key in,
you can check the risk to reward ratio if it is still
a good trade.
Never rush to buy a stock that has been in the top
volume for days. Nothing is free as this could
be a trap setup by the
professionals to trick the herd to go long so that the professionals can
transfer their holdings to the weaker buyers. Once the transferring is
done, the stock will
continue to move higher for the next few days but without
volume to support this upmove,
so the stock start to tumble down like a stack
of cards.
Dont be greedy, just be patience in trading.
Always buy at channel base where the stock is quiet and unnoticed
by majority
where there is sign of accummulation from the professionals. Such indicators in
my system to
determine this strength is as follow:
Test Base - professionals are probing the base, if
the next bar shows successful test, the price will go higher
Reduced Selling Pressure - after a big sell off,
market starts to cool off slowly and move sideway, reduced
elling pressure is
witnessed as any selling has been absorbed by the professionals so that they
can stage an
upmove in the near future when the catalyst for a bullrun is
present.
No Supply - selling has reduced significant and if
there is no selling, stock will move sideway or uptrend.
Markup - price is marked up to trick shortists to
cover their shorts, usually a "V" up move.
Demand coming in - professionals are coming in to
buy up with average to high transaction volume.
Bottom reversal - price reversal from bottom,
forcing shortists to worry and cover shorts
Climatic action - heavy transaction volume at the
lowest low but close higher near the day high, the professionals
are finding
worth in the stock and decide to absorb all selling and push price higher
instead.
Happy Profitable Trading!